
Results
Case Studies
Real results from real practices
Same team, same budget, same marketing. The only change was implementing the FASE Framework.
- +77%
- Q3 → Q4 growth
- $325K
- Peak month
2025 TC Implant Collections
Single owned implant center
The practice hired Full Arch Sales Experts in mid-October 2025. All results were achieved with the same Treatment Coordinator and no increase in marketing spend.
Client hired FASE mid-October · Practice was closed for 2 weeks in December
View table
| Month | Total monthly collections | Arch sales |
|---|---|---|
| January 2025 | $60,900.00 | 7 |
| February 2025 | $99,821.76 | 6 |
| March 2025 | $167,209.14 | 10 |
| April 2025 | $185,671.38 | 12 |
| May 2025 | $84,229.72 | 5 |
| June 2025 | $68,752.00 | 6 |
| July 2025 | $26,535.00 | 1 |
| August 2025 | $41,290.00 | 5 |
| September 2025 | $54,541.00 | 3 |
| October 2025 | $20,477.00 | 2 |
| November 2025 | $280,141.00 | 14 |
| December 2025 | $150,496.00 | 8 |
$325,322.55
Peak Month.
Single group full arch practice
- Same TC
- Same marketing budget
- No staffing changes
Results driven by implementing the FASE Framework. The client hired FASE mid-September.
View table
| Month | Total monthly collections |
|---|---|
| January 2025 | $83,408.12 |
| February 2025 | $107,464.76 |
| March 2025 | $156,917.61 |
| April 2025 | $149,956.14 |
| May 2025 | $190,725.44 |
| June 2025 | $173,519.63 |
| July 2025 | $156,001.08 |
| August 2025 | $114,388.41 |
| September 2025 | $134,066.68 |
| October 2025 | $325,322.55 |
+52% Conversion Rate
Single owned practice
50% fewer leads. Nearly 50% fewer calls. Through lead call training, the show rate more than doubled. Through sales training, the close rate increased by 36%. That efficiency gain produced 7 more arches and $150K in additional revenue, with half the opportunity.
October 2025
November 2025
+77%
Growth Q3 → Q4.
Single owned practice
- Same TC
- Same marketing budget
- No staffing changes
| Q4 month | Collections | Conversion |
|---|---|---|
| October 2025 | $325,000.00 | 38% |
| November 2025 | $166,000.00 | 27% |
| December 2025 | $223,000.00 | 100% |
Year-Over-Year Growth
Monthly collections
- Same TC
- Same marketing budget
- No staffing changes
| Month | 2024 | 2025 | 2026 |
|---|---|---|---|
| October | $85,313.00 | $126,437.00 | — |
| November | $92,245.00 | $78,093.00 | — |
| December | $58,117.00 | $160,719.00 | — |
| January | $43,722.00 | $48,475.00 | $128,529.00 |
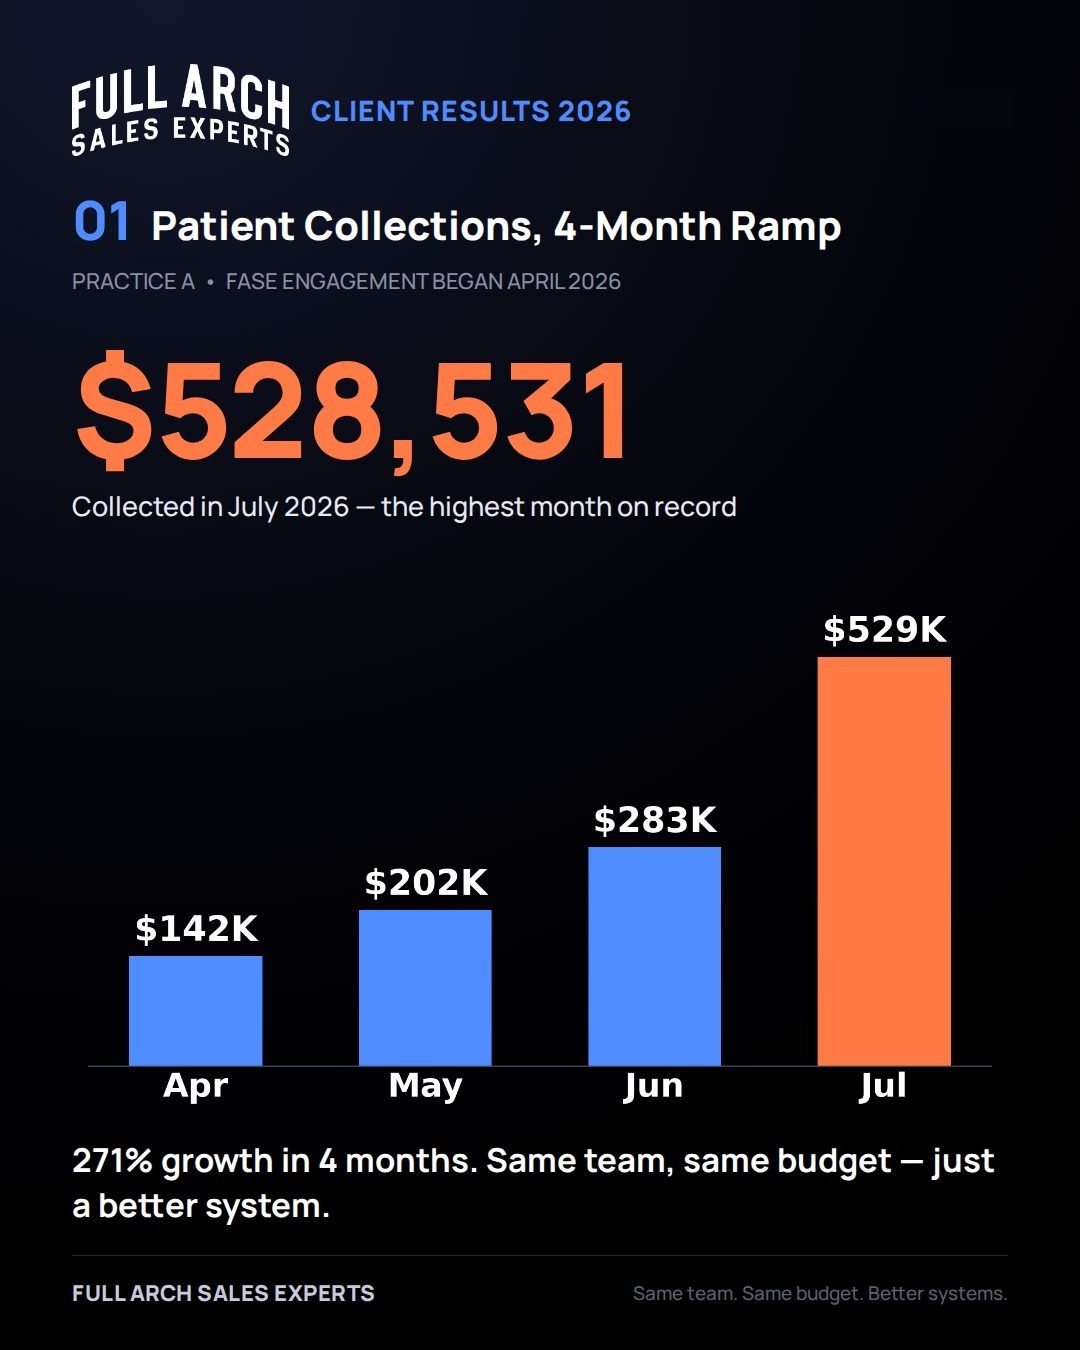
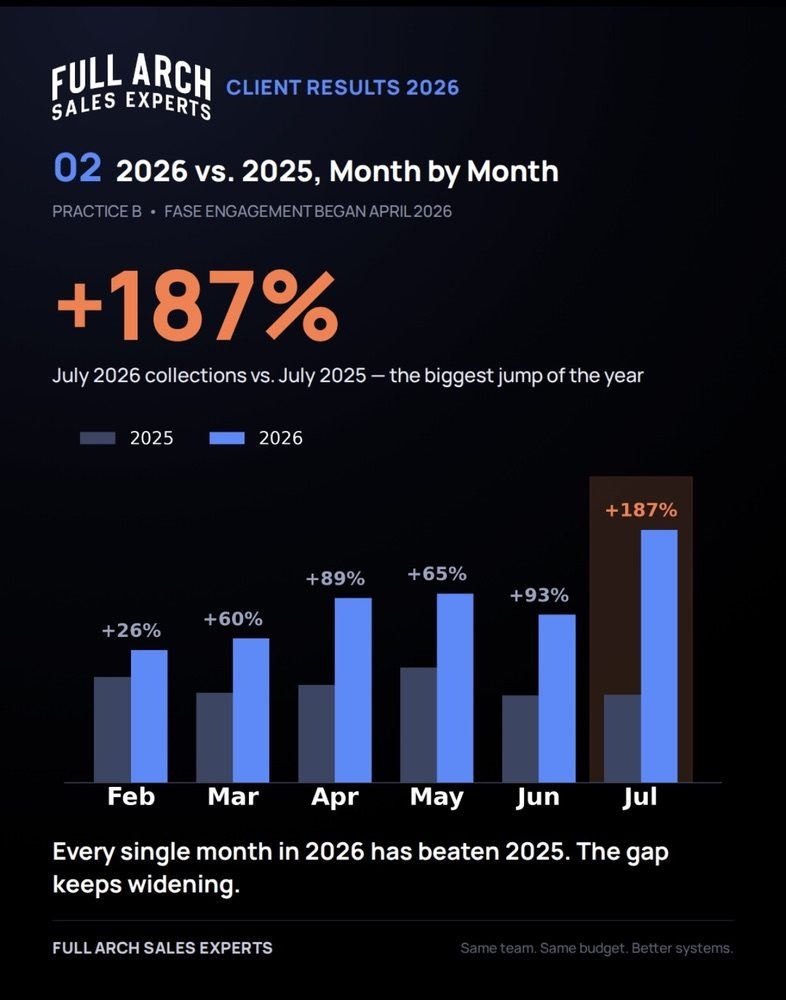
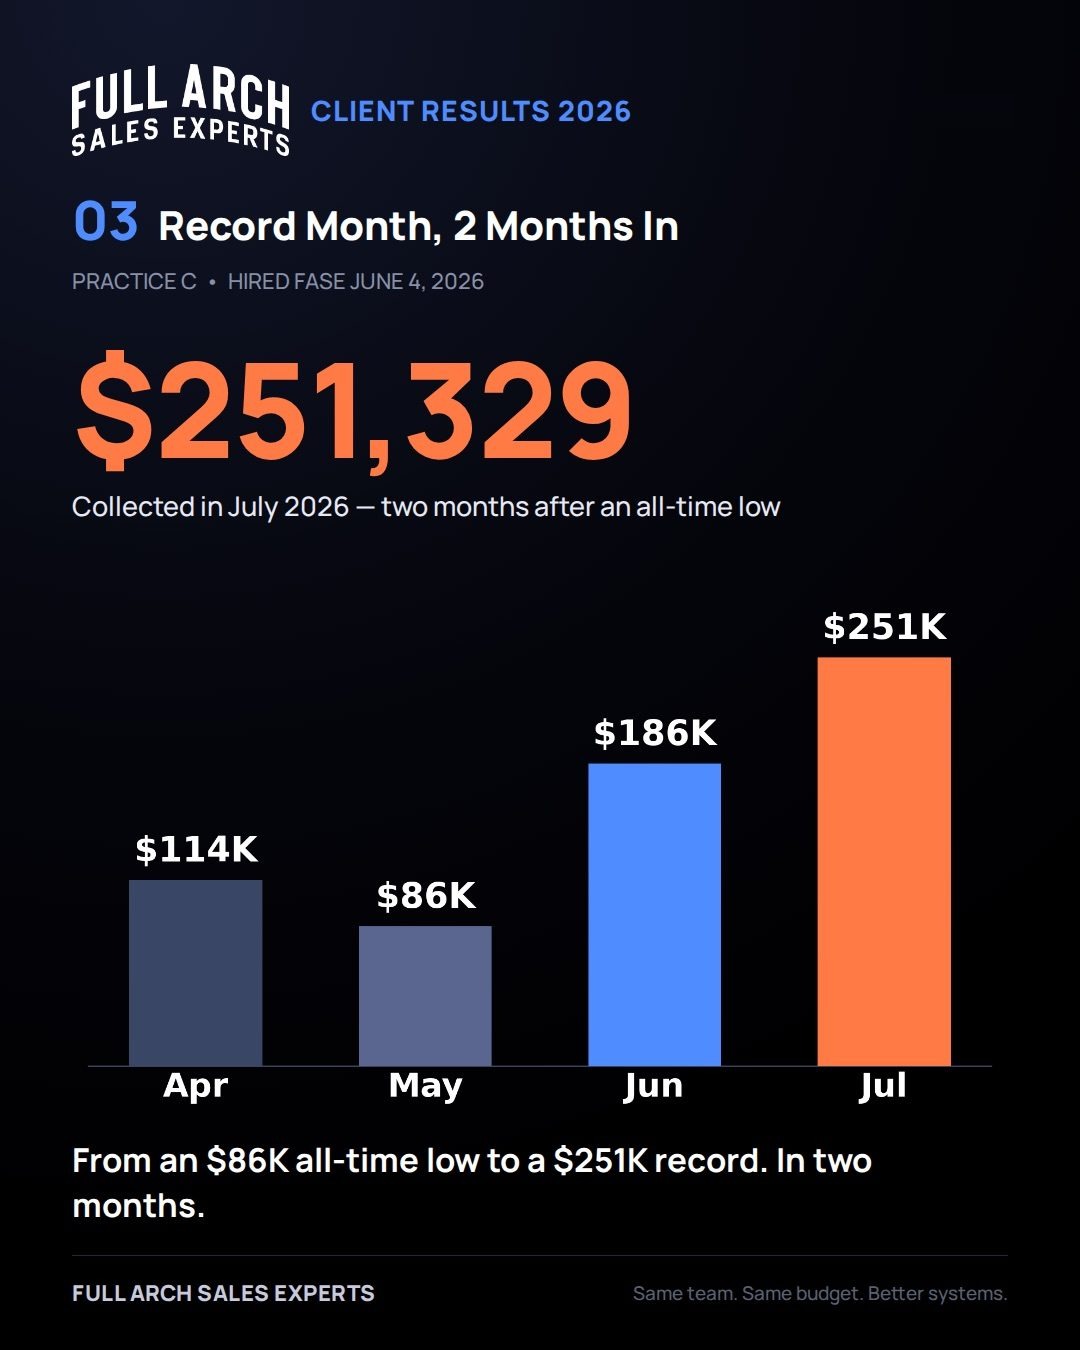
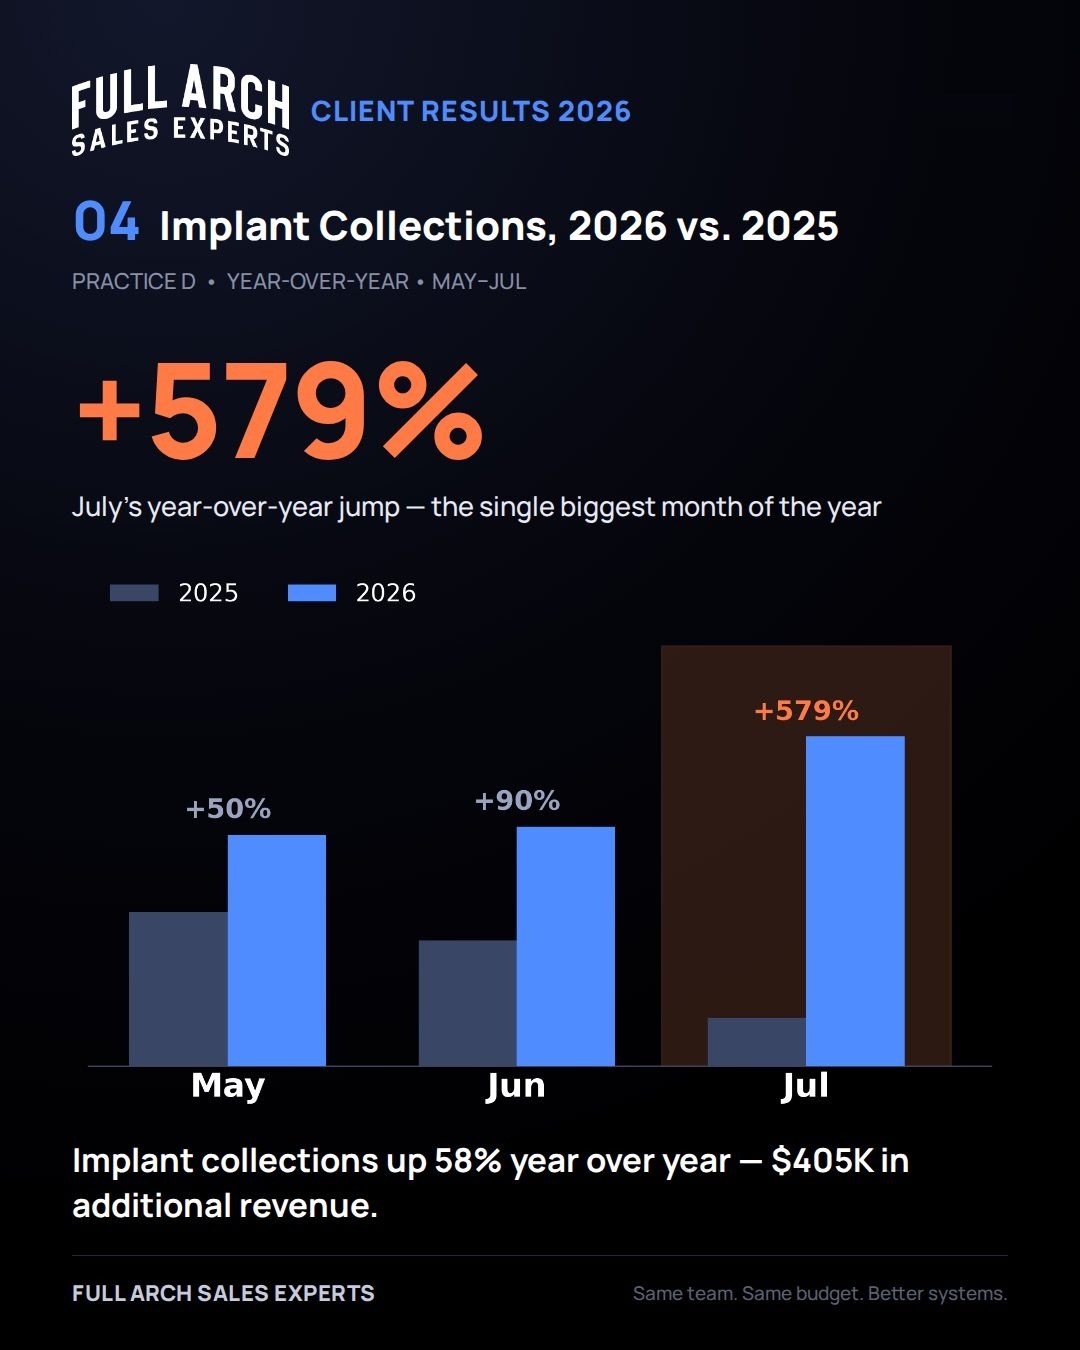
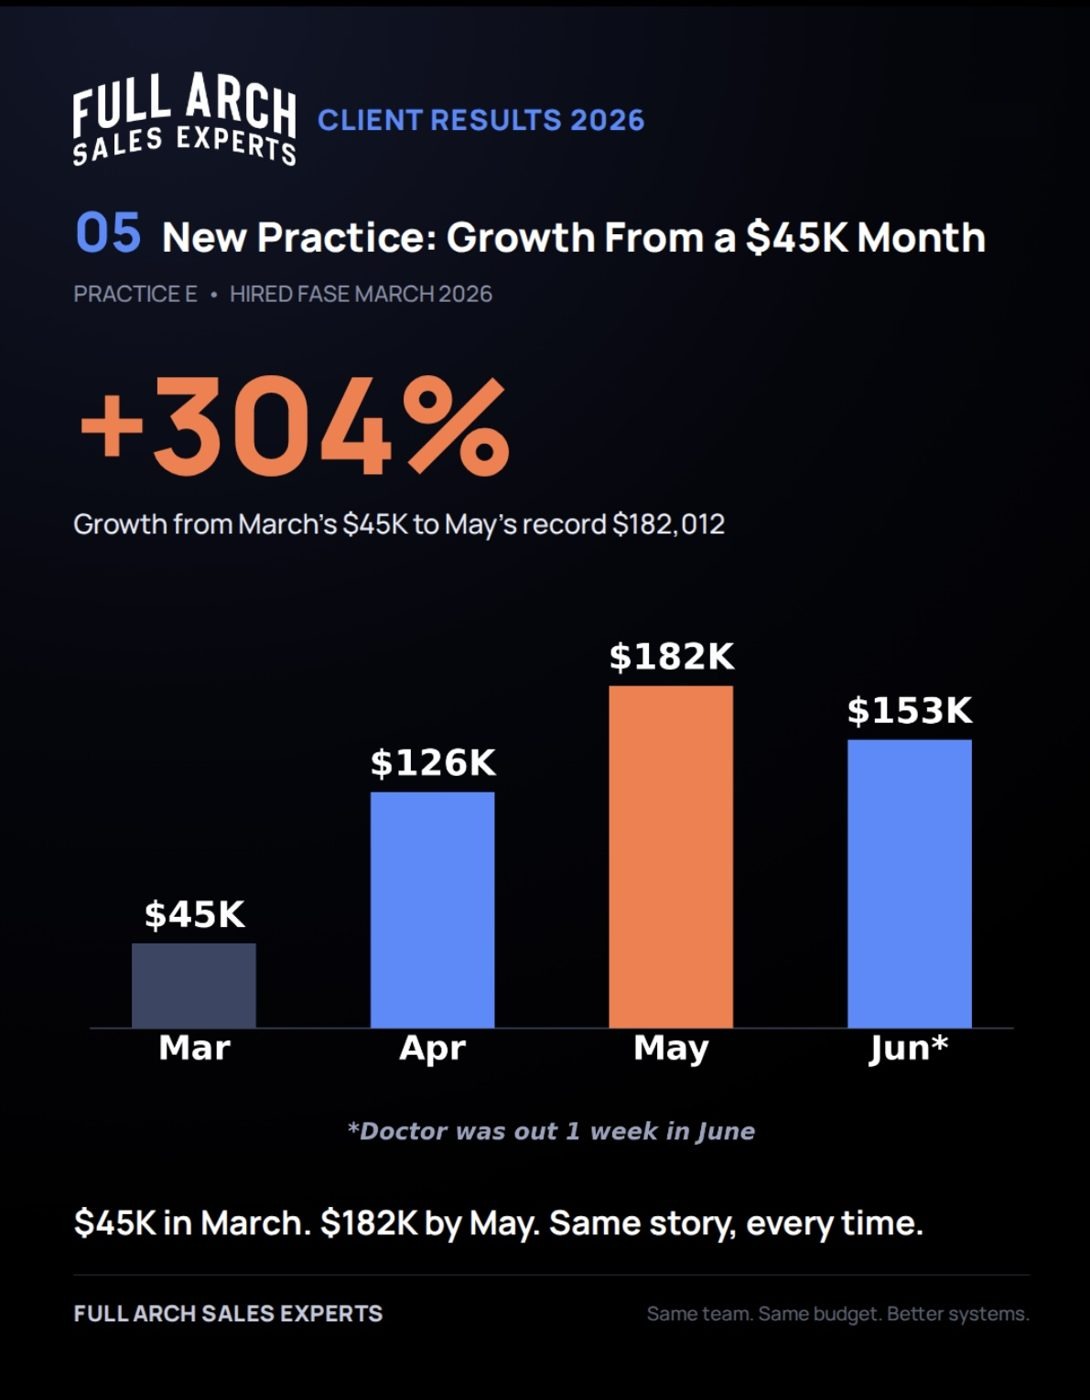
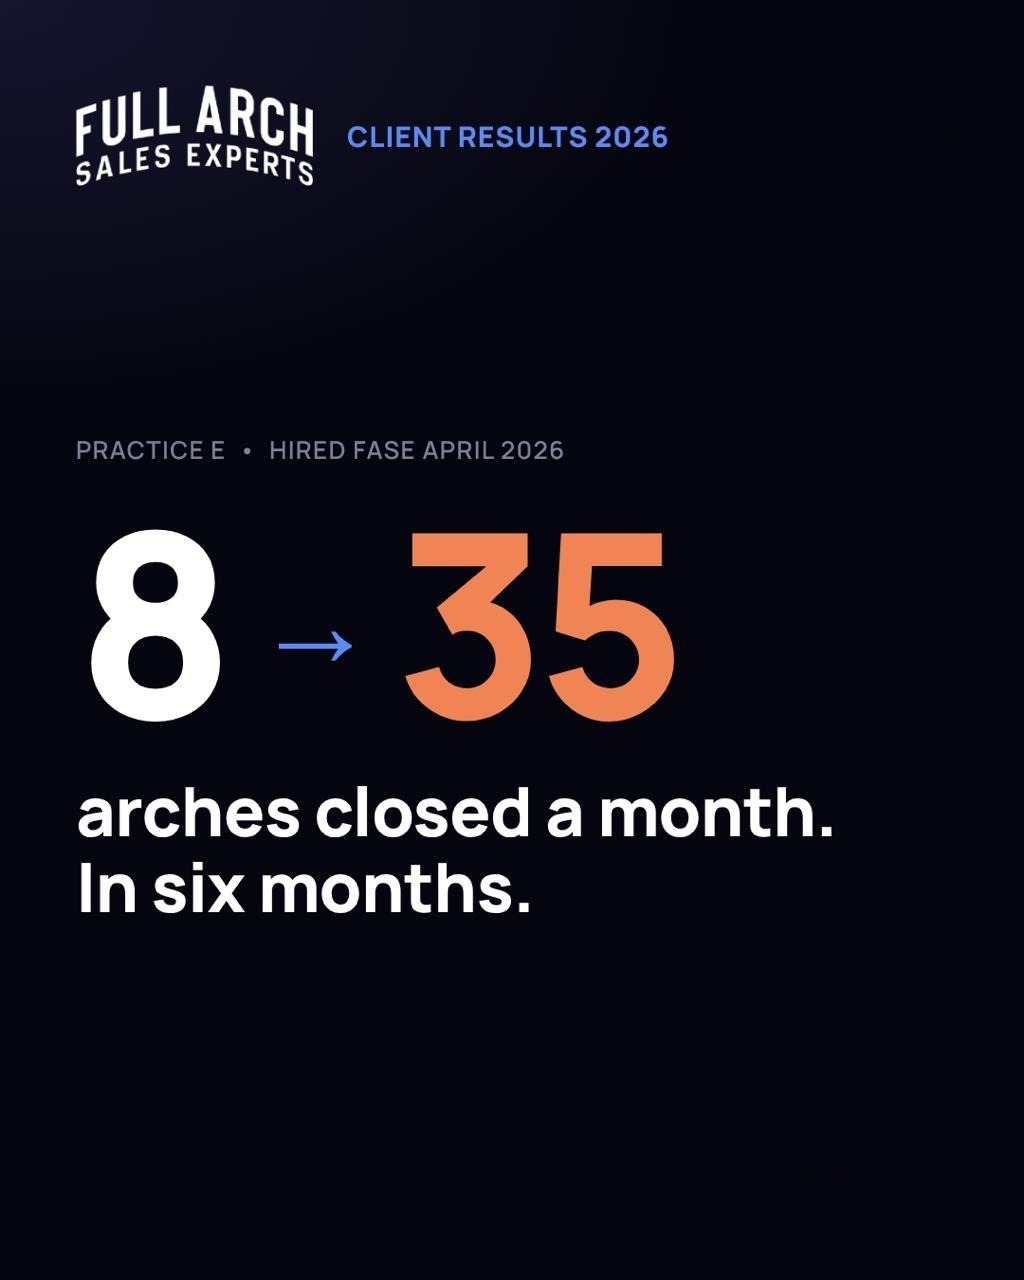
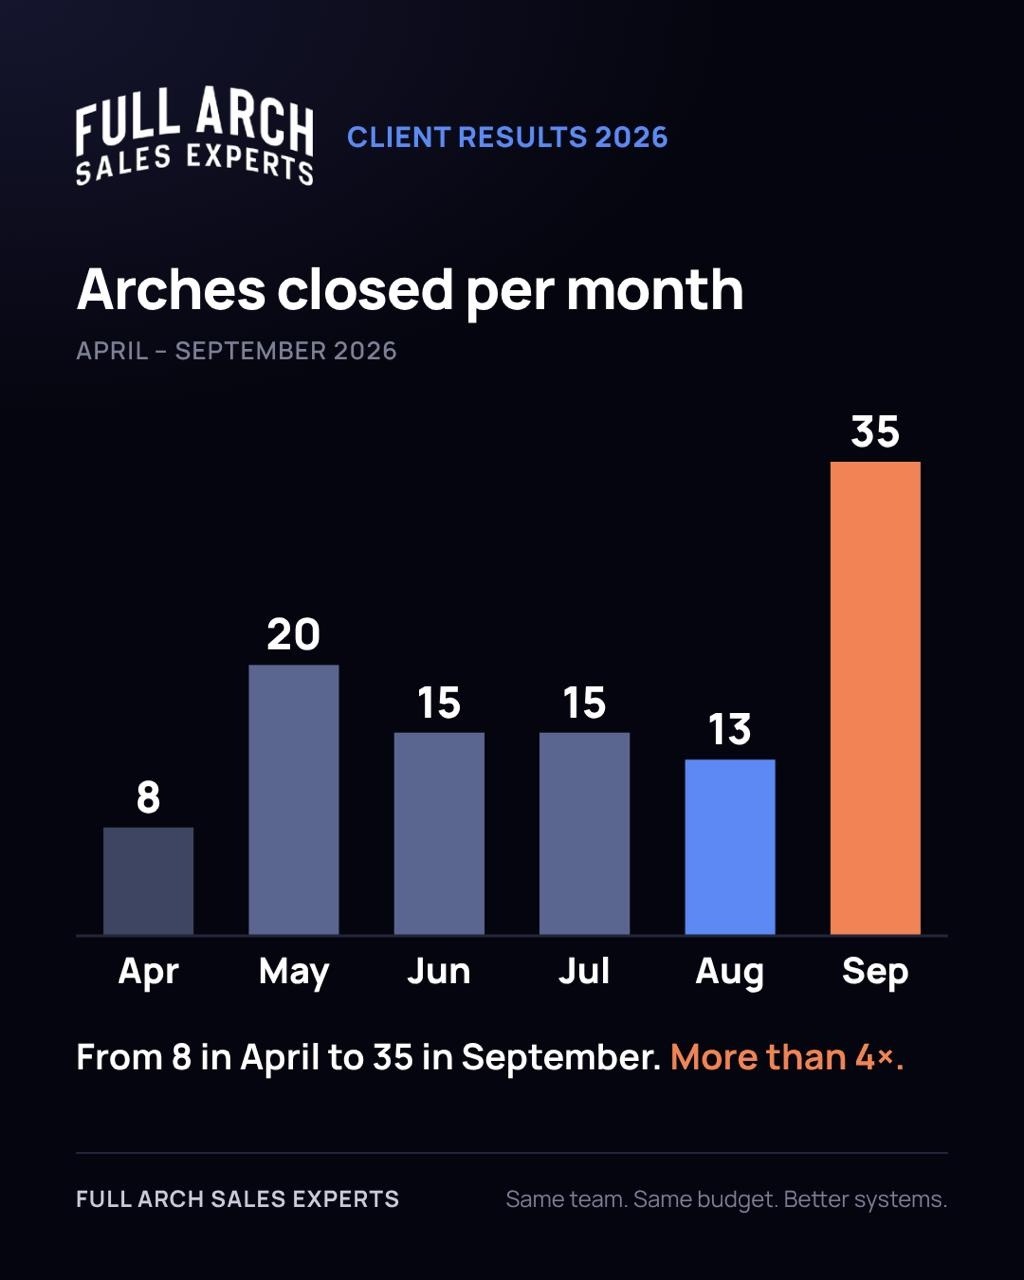
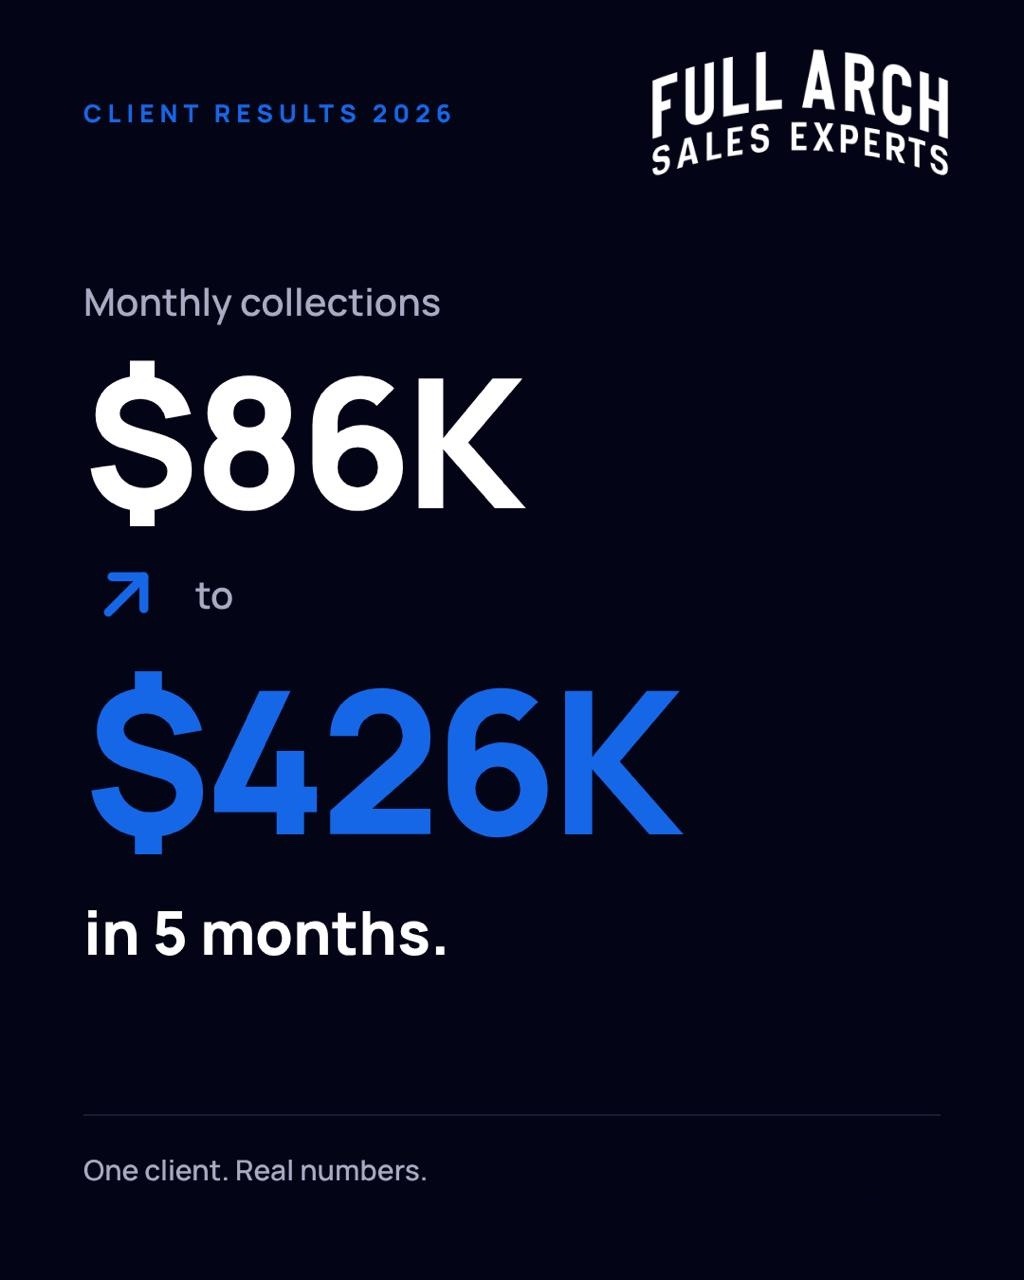
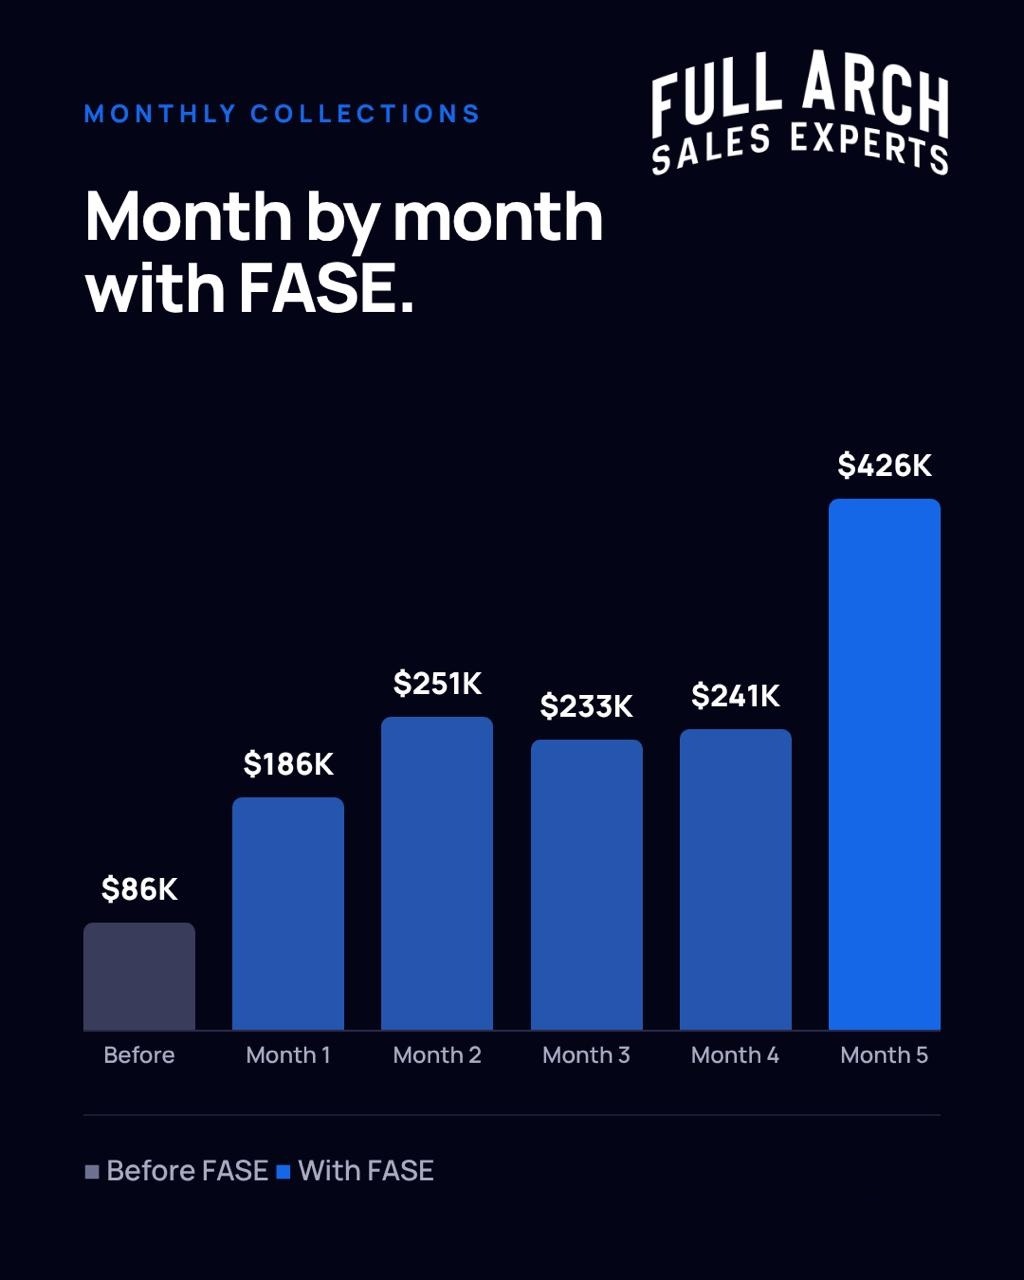
Client Results 2026
The Latest Wins.
Same team. Same budget. A better system.
Ready for Results Like These?
Same team. Same budget. Different framework. Book a discovery call to see how FASE can work for your practice.